Lab 02: Strain Gages
AE 417 · Aerospace Structures and Instrumentation Laboratory · Fall 2025 · ERAU
Experiment Overview
Strain gages are the workhorse sensor of structural testing. They appear on aircraft structural test articles, wind turbine blades, bridge load cells, and Formula 1 suspension components. Unlike extensometers, they can be bonded to any surface, measure highly localized strain, and operate in environments where no other sensor could reach. This lab covered the full installation process from raw surface preparation through data collection, developing practical skills that are directly applicable to structural health monitoring, load cell design, and experimental stress analysis.
- Install a 120 Ω foil strain gage on an Al 6061-T6511 beam following Vishay installation procedures
- Measure resistance changes under bending loads in both tension and compression orientations
- Derive Young’s modulus E for both the aluminum beam and a Nomex/CFRP honeycomb sandwich beam via Hooke’s law
- Compare computed modulus values against handbook data and assess sources of error

Equipment & Tools
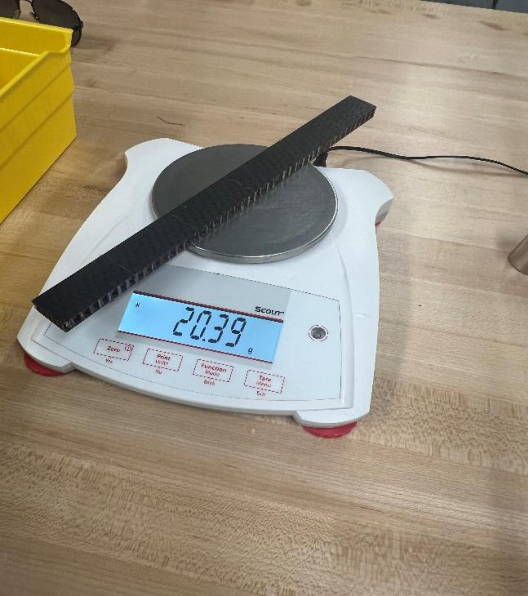
- Al 6061-T6511 aluminum strip beam and Nomex honeycomb beam with CFRP skin
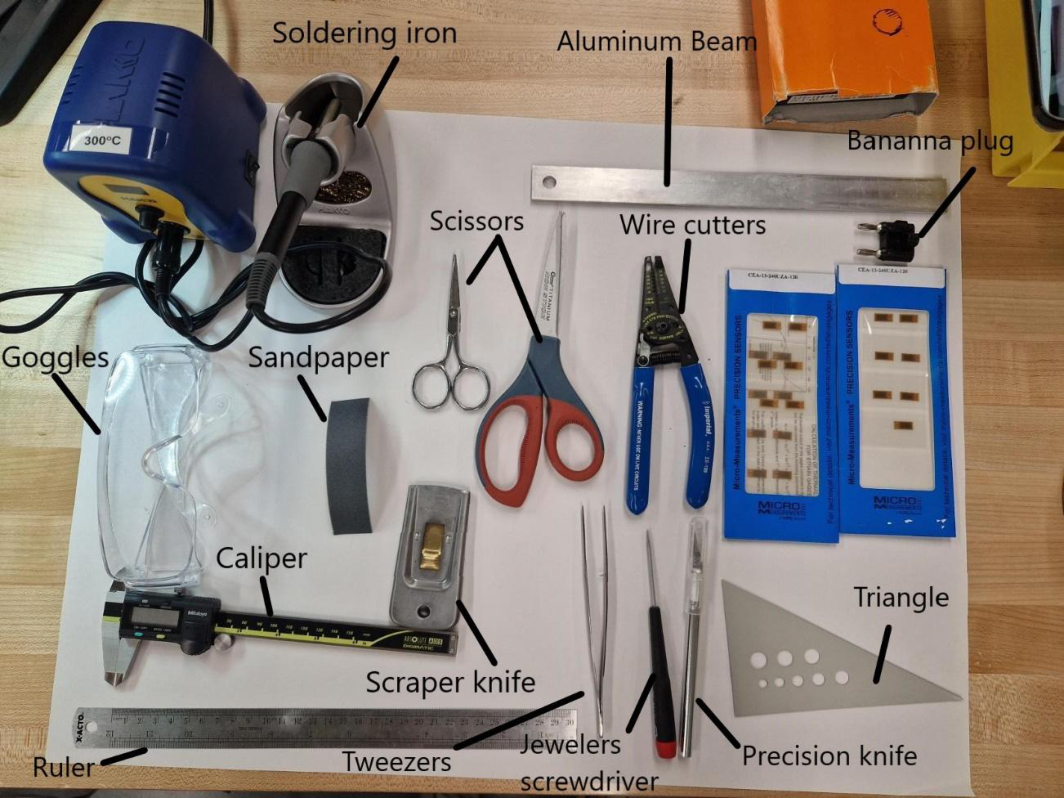
- 120 Ω Micro-Measurements foil strain gages (GF = 2) and bondable terminals
- 26 AWG strain gage wire, banana plug, and Fluke digital multimeter
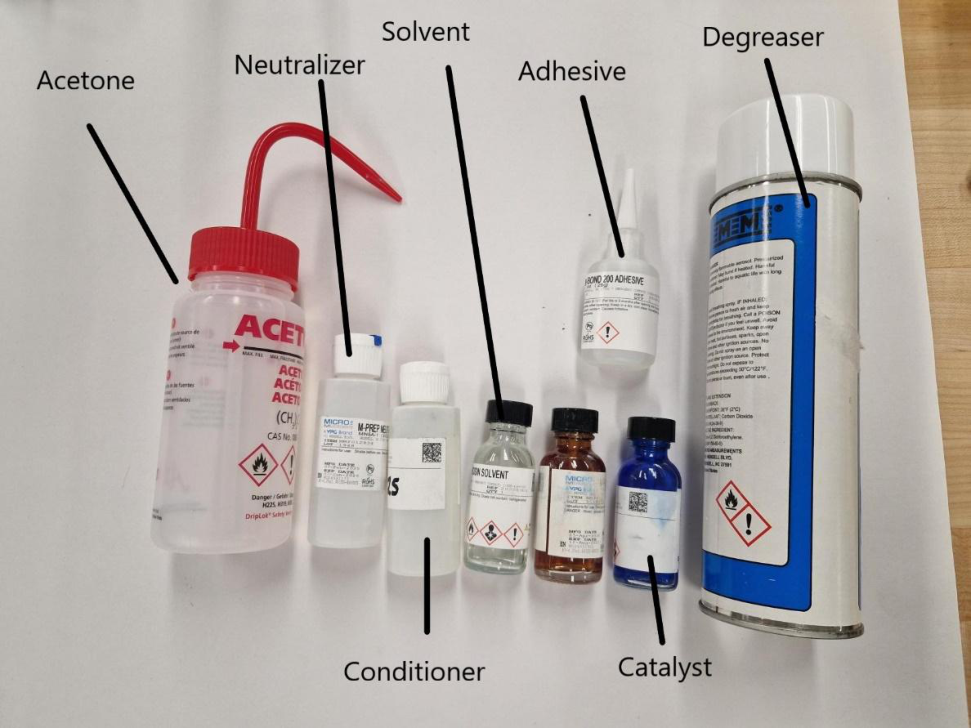
- Vishay M-Bond 200 adhesive and catalyst; M-Prep Conditioner A and Neutralizer 5A
- Soldering iron, solder flux, sandpaper (320 and 400 grit), acetone, gauze sponge
- Calibration masses (1, 2, 3 kg) and C-clamp
Approach & Key Equations
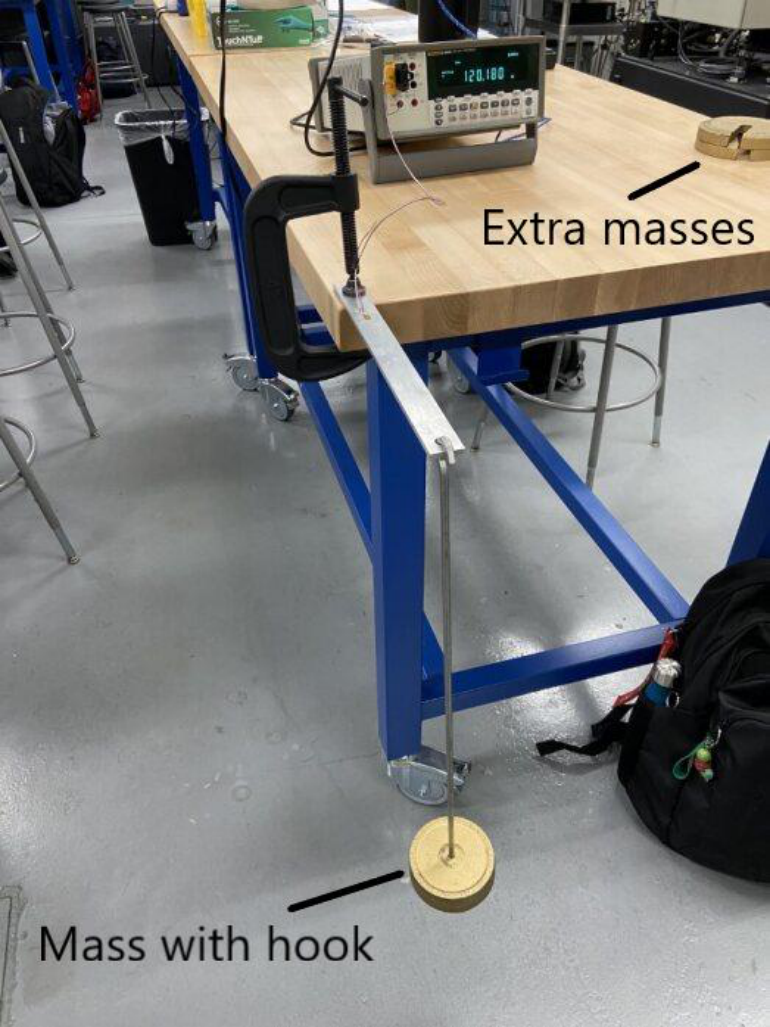
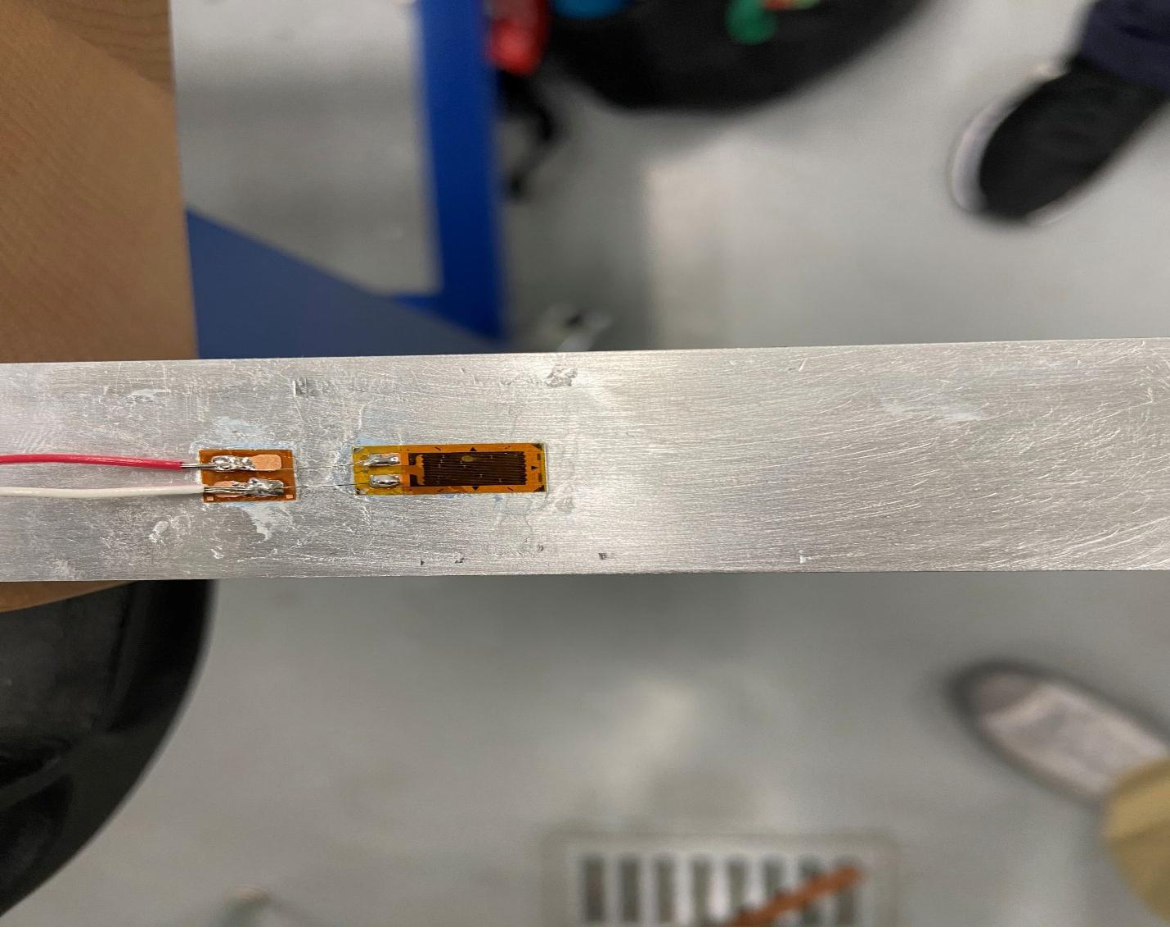
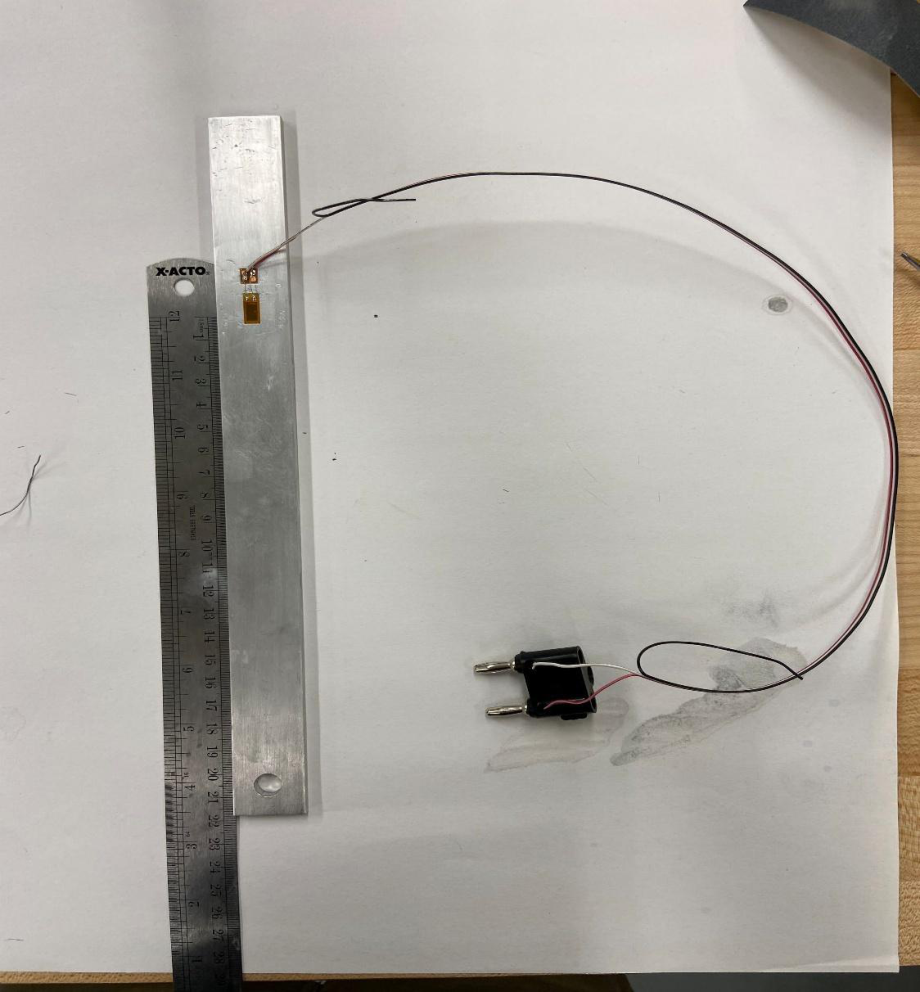
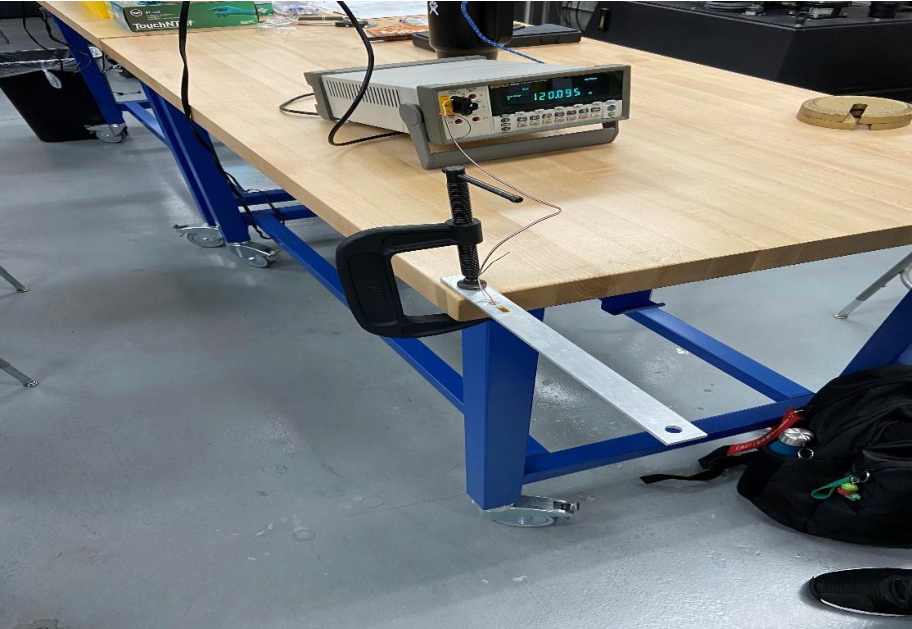
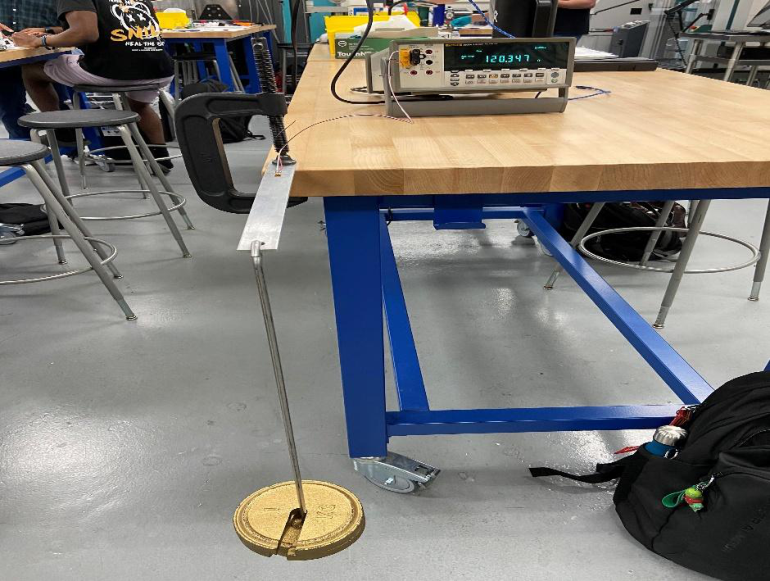
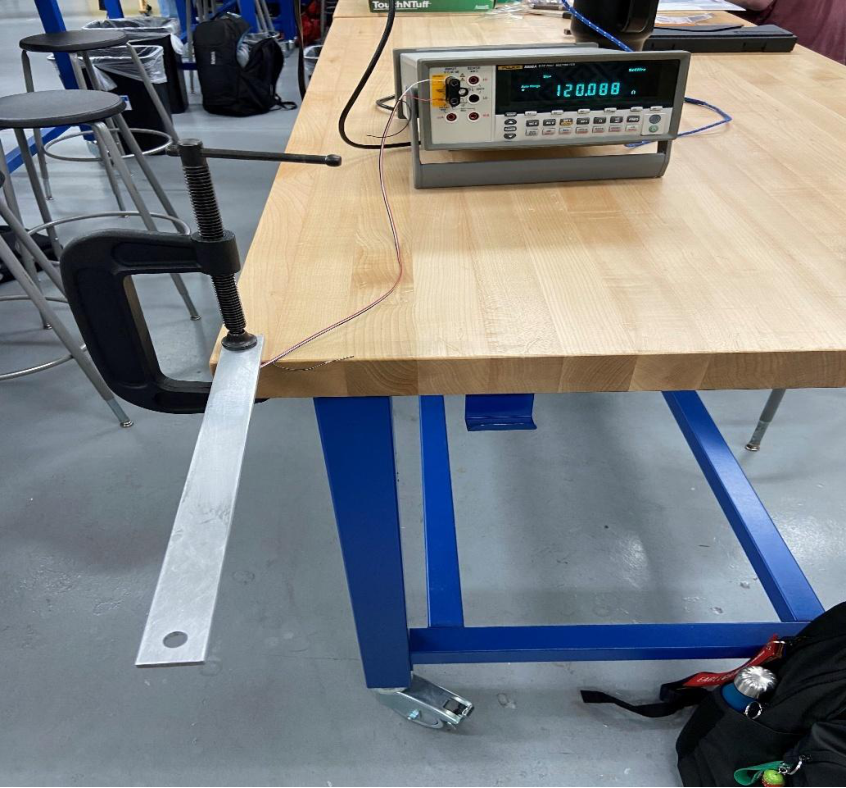
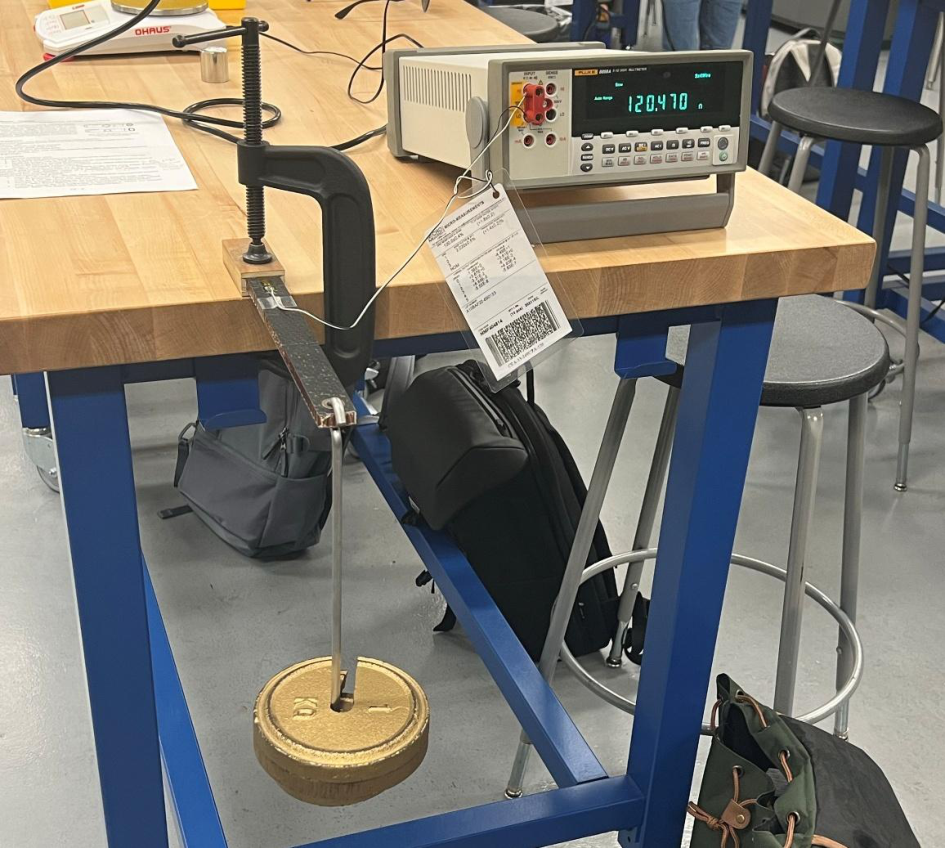
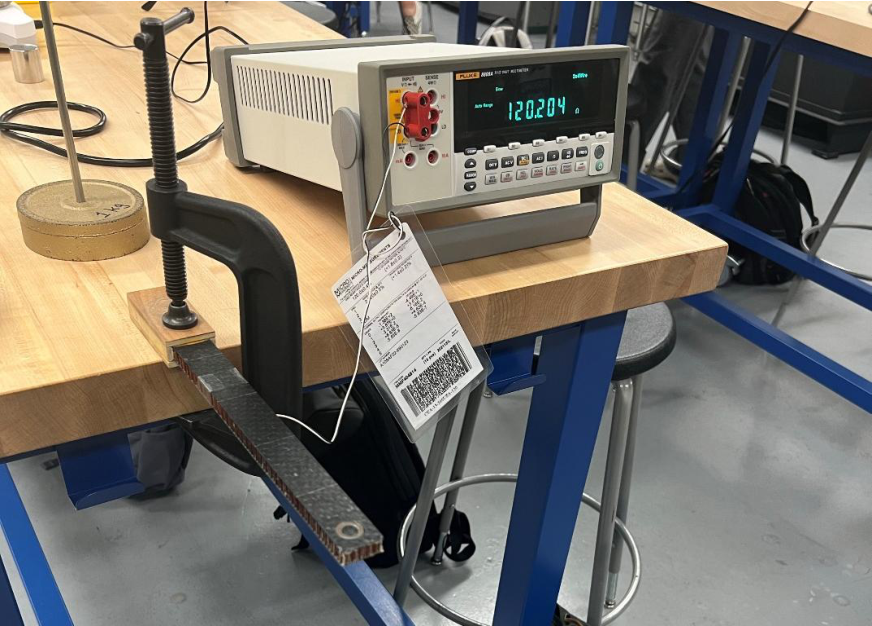
The aluminum beam surface was degreased, sanded through 320 and 400 grit, conditioned with M-Prep Conditioner A, then the gage was positioned and bonded with M-Bond 200 adhesive and catalyst following Vishay bulletin B-127-14. Lead wires were soldered and connected via banana plug to a digital multimeter, which measured resistance to 0.001 Ω resolution. The beam was cantilevered in a “diving board” configuration and masses of 1, 2, and 3 kg were hung from the free end. Bending strain was computed from the measured resistance change ΔR and the gage factor GF:
ε = (ΔR / R) / GF
Bending stress was calculated from beam theory (σ = My/I for the aluminum beam; σ = M/(h·tf·b) for the sandwich beam), and Young’s modulus extracted as E = σ/ε.
Key Results
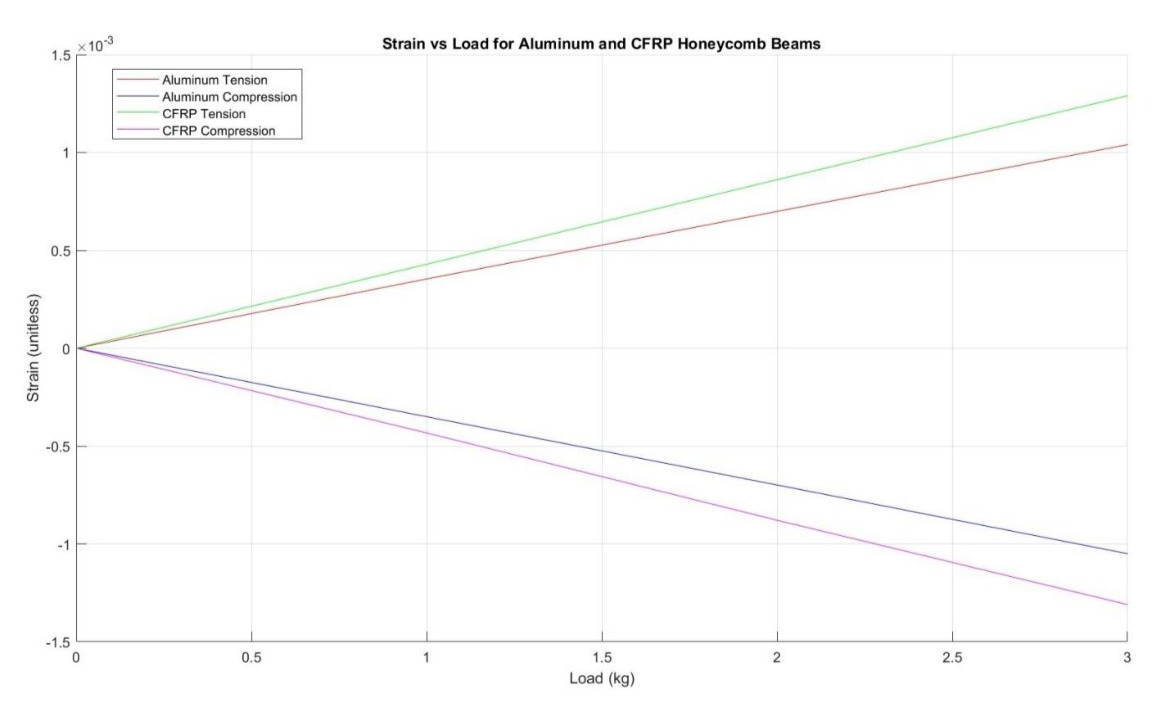
- Aluminum beam resistance changed by ~0.08 Ω per kilogram of load in both tension and compression — nearly symmetric responses that validated correct gage installation and consistent material behavior.
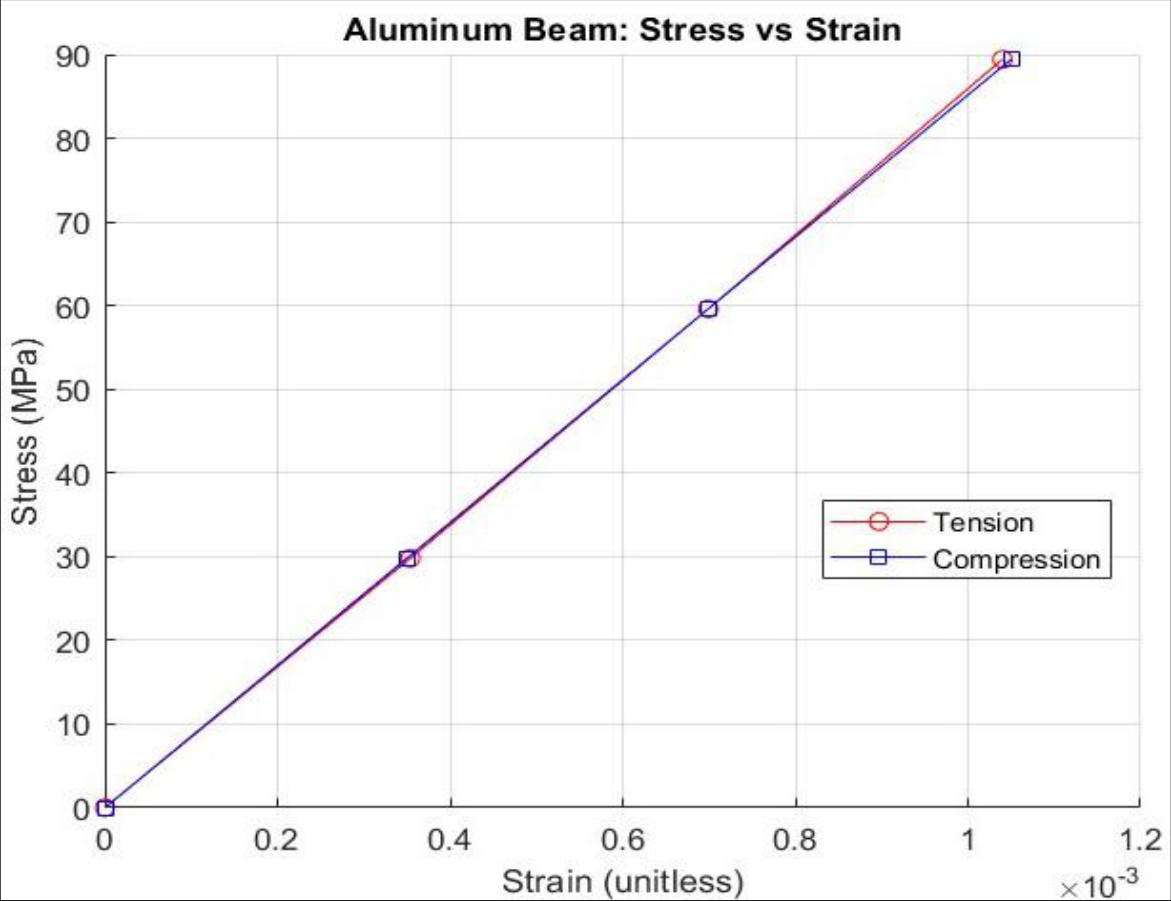
- EAl = 84 GPa vs. handbook value of 69 GPa for 6061-T651 (17.9% error) — attributed to minor gage misalignment during bonding and surface preparation variability.
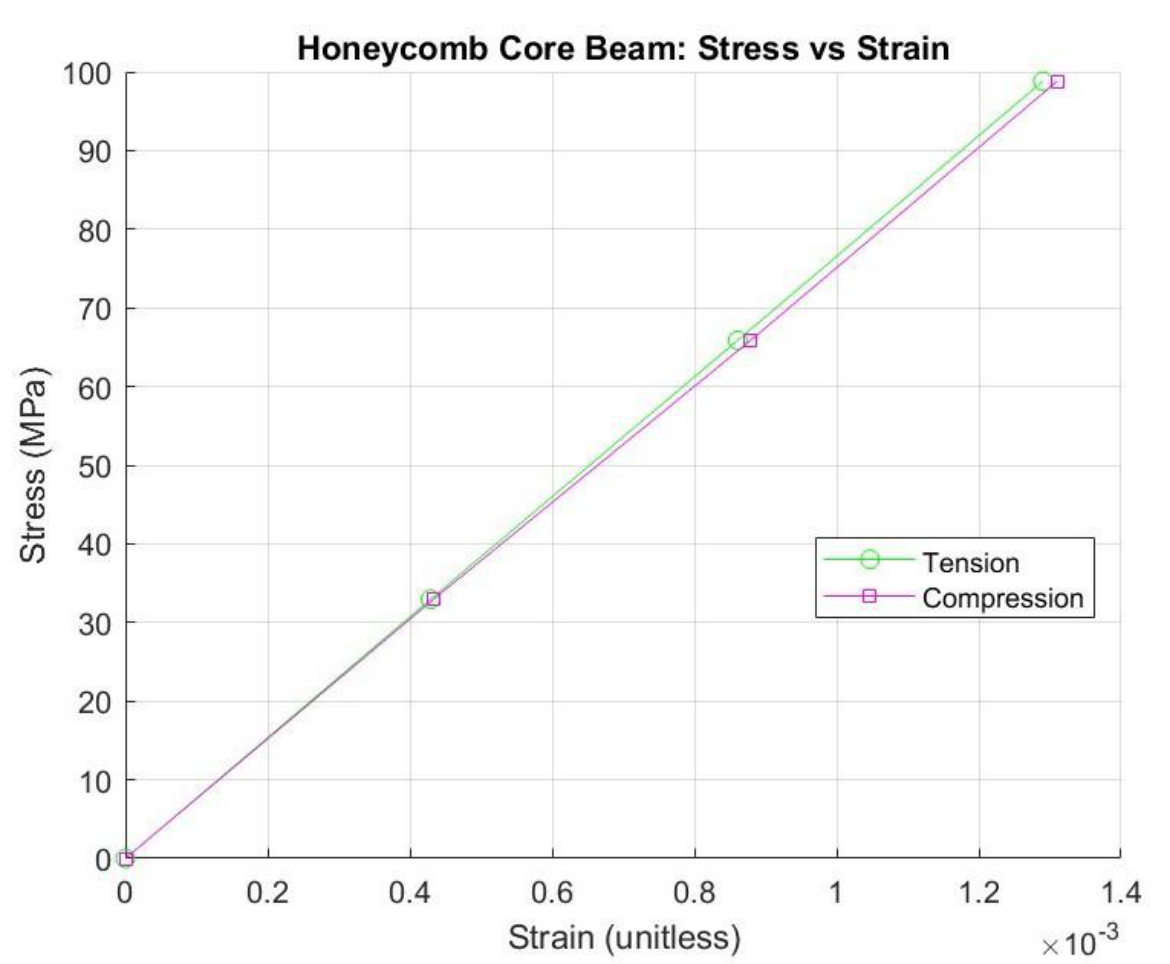
- Ehoneycomb = 74 GPa for the Nomex/CFRP sandwich beam — within the expected 70–120 GPa range for woven carbon fiber facing skins.
- At identical loads, the honeycomb beam showed less strain than the aluminum beam, confirming its higher effective bending stiffness per unit cross-section thanks to the sandwich construction principle.
- Stress-strain curves for tension and compression were nearly coincident, validating symmetric material response in the elastic regime.
MATLAB Code
Two scripts handled strain-load plotting and stress-strain curve generation using measured beam geometry and bending theory formulas.
% Strain from resistance change and gage factor (GF = 2)
al_strain_T = [0  0.000354  0.000699  0.00104];   % aluminum tension
hc_strain_T = [0  0.000429  0.000861  0.00129];   % CFRP tension

% Aluminum bending stress: sigma = M*y / I
M_al     = F * L_al;                  % N·m
sigma_al = M_al .* y_al ./ I_al;     % Pa

% CFRP sandwich facing stress: sigma = M / (b * h_f * t_face)
sigma_cf = M_cf ./ (b_cf * h_f * t_face);

% Young's modulus at 1 kg: E = sigma / epsilon
E_Al   = sigma_al(2) / al_strain_T(2);  % – 84 GPa
E_CFRP = sigma_cf(2) / hc_strain_T(2); % – 74 GPa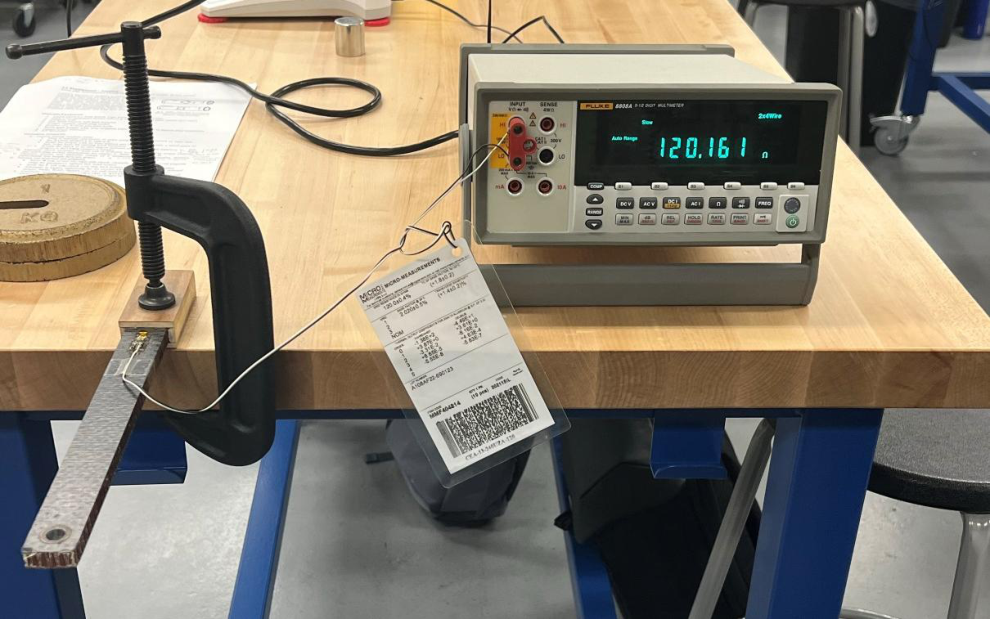
Valuable Takeaways
- Strain gage installation is a high-precision craft. Surface preparation, gage alignment, adhesive application, and lead wire soldering each introduce potential error. The 17.9% Young’s modulus error versus handbook data shows directly how installation quality affects result accuracy.
- The sandwich beam demonstrates why composite structures are so weight-efficient. Separating stiff facing skins with a lightweight core dramatically increases bending stiffness per unit mass — the same principle used in aircraft floors, fuselage panels, and spacecraft structures.
- Symmetric tension and compression responses are the signature of proper gage installation. Asymmetry would indicate gage misalignment, a debonded terminal, or nonlinear material behavior — skills in recognizing these signatures matter in any structural instrumentation role.
- Gained practical proficiency in the full strain gage workflow — surface prep, adhesive bonding, soldering, Wheatstone bridge measurement, and MATLAB data analysis — transferable directly to flight test and structural health monitoring applications.